LetMeShip — Customer Booking Analysis & Prediction
A BI project focused on descriptive dashboards (Tableau) and a predictive model (Orange) to understand booking behavior and forecast insurance selection.

Scope
Customer booking analytics + insurance prediction
Tools
Tableau, Tableau Prep, Orange, Excel
Outputs
Dashboards, data model, predictive model evaluation
Overview
LetMeShip provided an extensive shipment dataset to explore what drives customer booking behavior, service preferences, operational reliability, and profitability. We designed a data model for robust analysis, built dashboards in Tableau, and developed a predictive model in Orange to forecast insurance type selection.
- Explored shipment facts to understand service usage, reliability, and profitability.
- Built a clean star-schema friendly dataset in Tableau Prep.
- Designed descriptive dashboards in Tableau for decisions across regions, carriers, and branches.
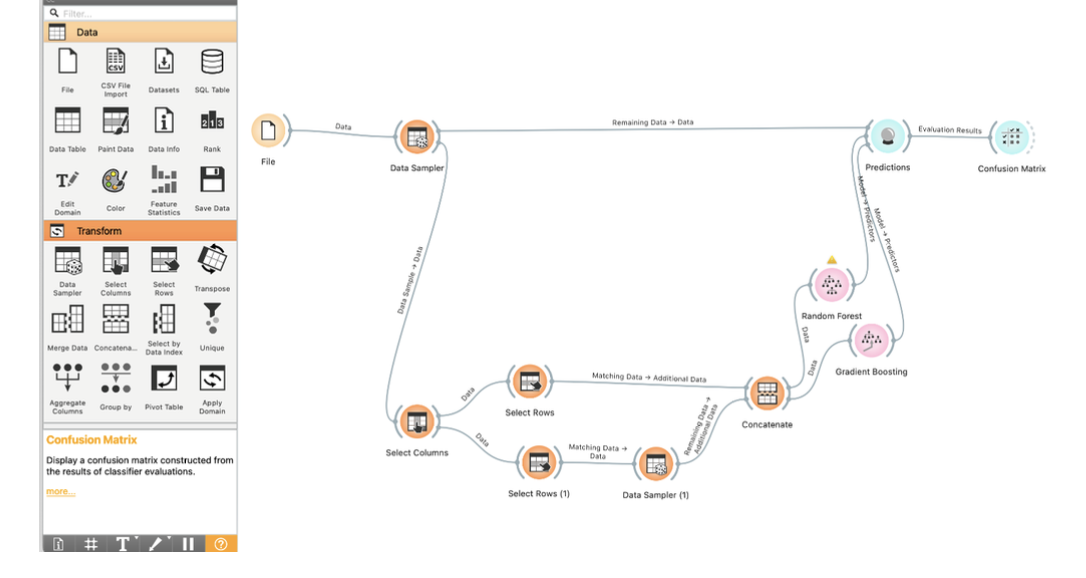
- Developed an Orange workflow to predict the most likely insurance type (No / Basic / Premium).
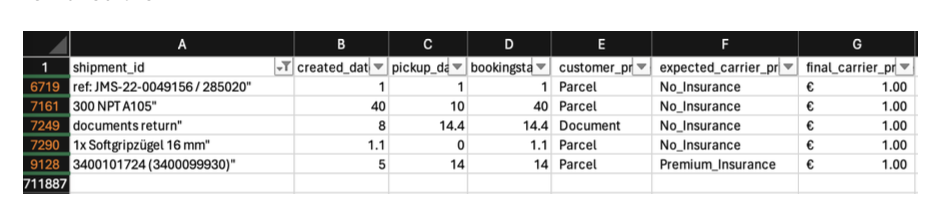
Data preparation
Before dashboarding, the dataset required multiple preprocessing iterations due to inconsistencies (IDs, country codes, branch assignment, duplicate relationships, and date anomalies). We documented assumptions so the dashboards remain interpretable and trustworthy.
Cleaning & standardization
Fixed missing/invalid IDs, normalized country codes, and resolved branch assignment issues so dimensions join correctly.
Duplicates & relationships
Removed duplicate relationships and ensured 1-to-many joins remain stable to avoid inflated counts in dashboards.
Date anomalies
Handled missing and future-dated pickup/delivery values to keep lead-time and reliability metrics trustworthy.
Documented assumptions
Recorded exclusions and transformations so the dashboards remain interpretable and auditable.
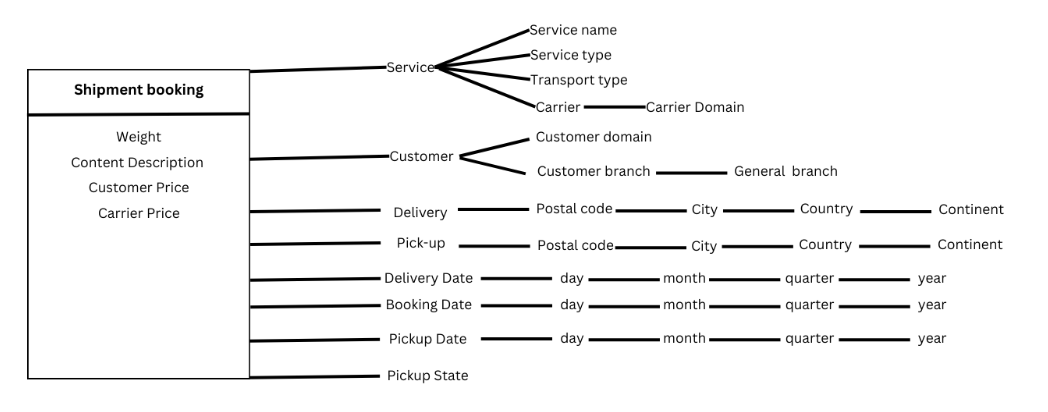
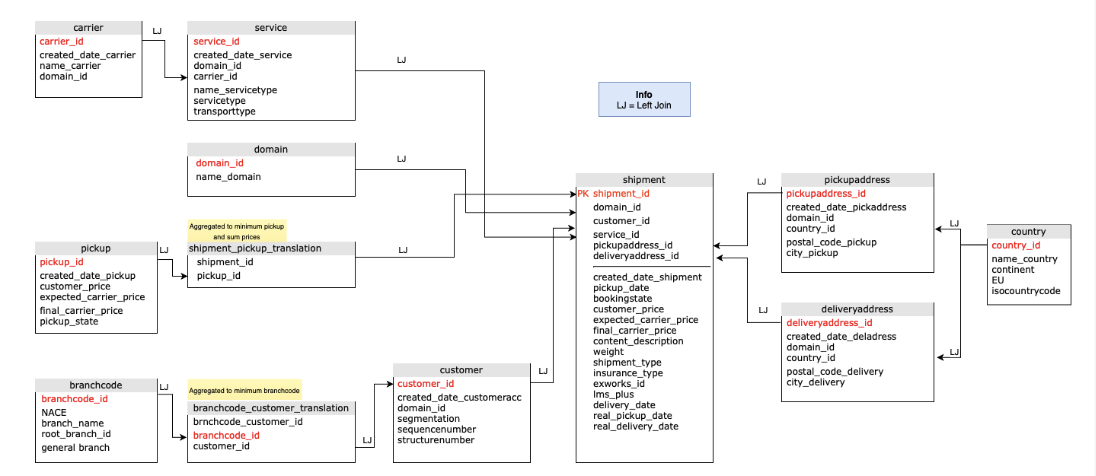
Data model
A clean model was essential to link shipment facts to the dimensions required for analysis (customer, carrier, transport type, and geography). We created an ME/R model to clarify relationships and implemented a Star Schema in Tableau Prep to ensure stable, scalable joins.
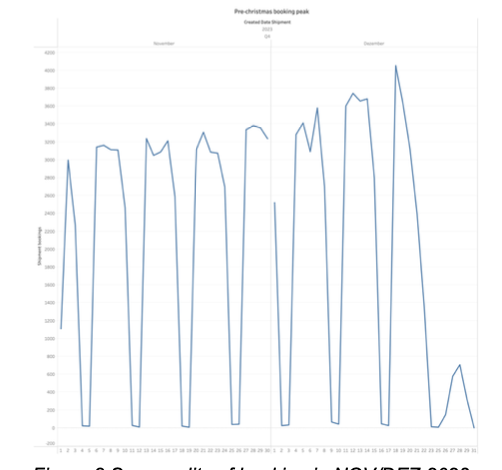
Descriptive insights (dashboards)
Service mix by branch
Transport types vary by branch; some branches rely heavily on a narrow service mix, indicating resilience risk.
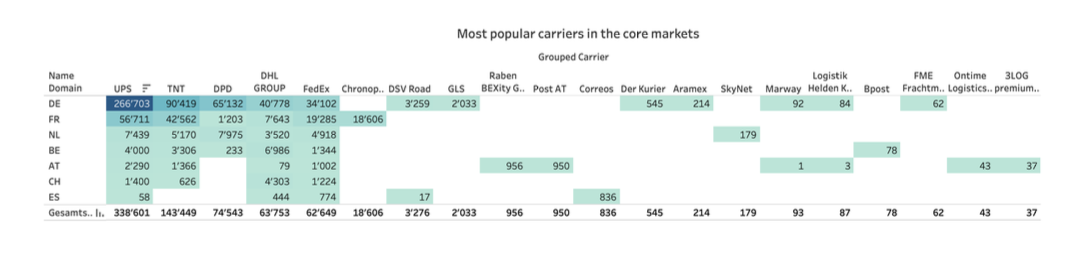
Carrier preferences
Carrier selection differs by customer segment and region, suggesting targeted carrier partnerships are valuable.
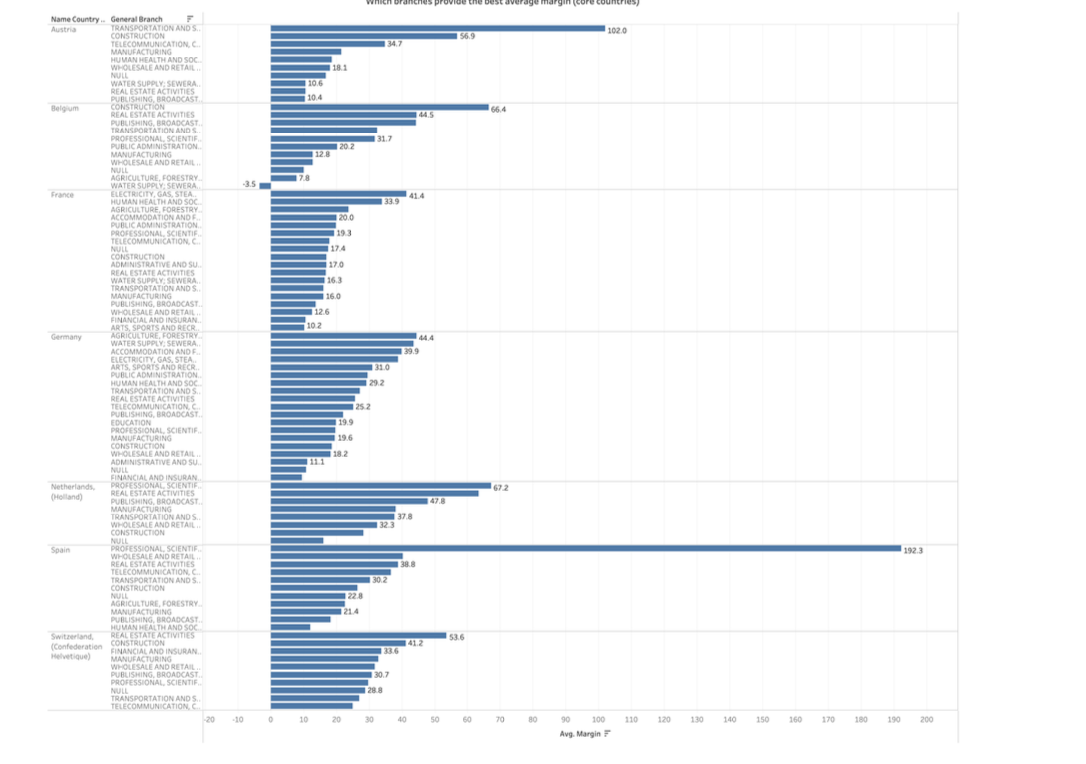
Margins & profitability
Profitability depends on carrier, route, and service. Some segments show strong relative margin but lower volume.
Branch profitability
Top total margins came from manufacturing, retail, real estate, and transportation; some branches showed higher relative margin (per customer).
Predictive task
Goal
Predict the insurance type a customer will book (No / Basic / Premium) to personalize offers and improve operational efficiency.
Key challenge
Class imbalance: 'No Insurance' dominated the dataset. We used sampling strategies so minority classes can be learned reliably.
Models compared
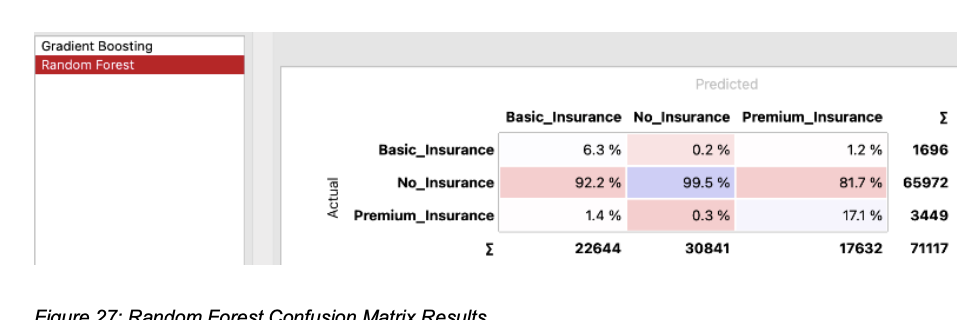
Random Forest vs Gradient Boosting. Gradient Boosting performed more balanced across classes, while Random Forest tended to over-predict 'No Insurance'.
Model performance (what mattered)
Accuracy is not enough
Overall accuracy can look good while still missing Basic/Premium. We focused on class-wise performance, not only the headline score.
Business value
Better minority-class performance supports upsell opportunities (Basic/Premium) and improves how recommendations are triggered in the platform.
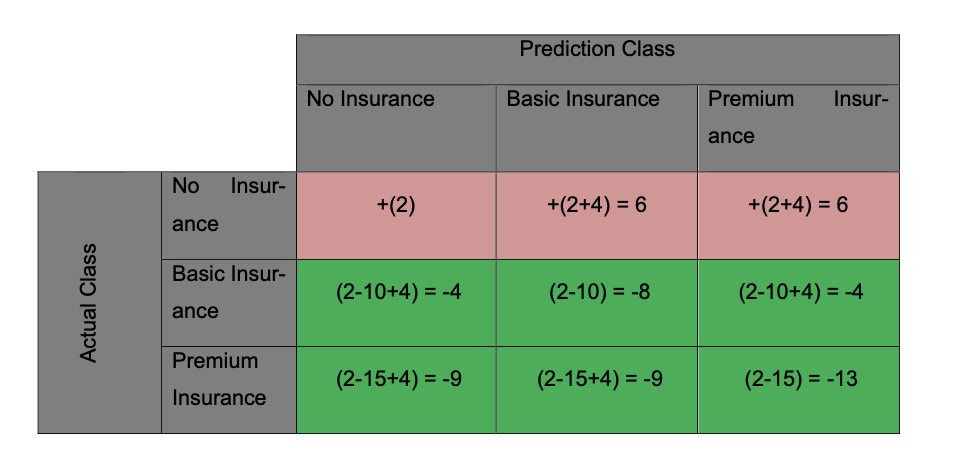
The key business takeaway: the “best” model is not just the most accurate overall — it’s the one that performs reliably on minority classes (Basic/Premium), where revenue and upsell opportunities prevent leaving money on the table.
Want a walkthrough?
I can share a short demo of the Tableau dashboards and the Orange modeling pipeline.