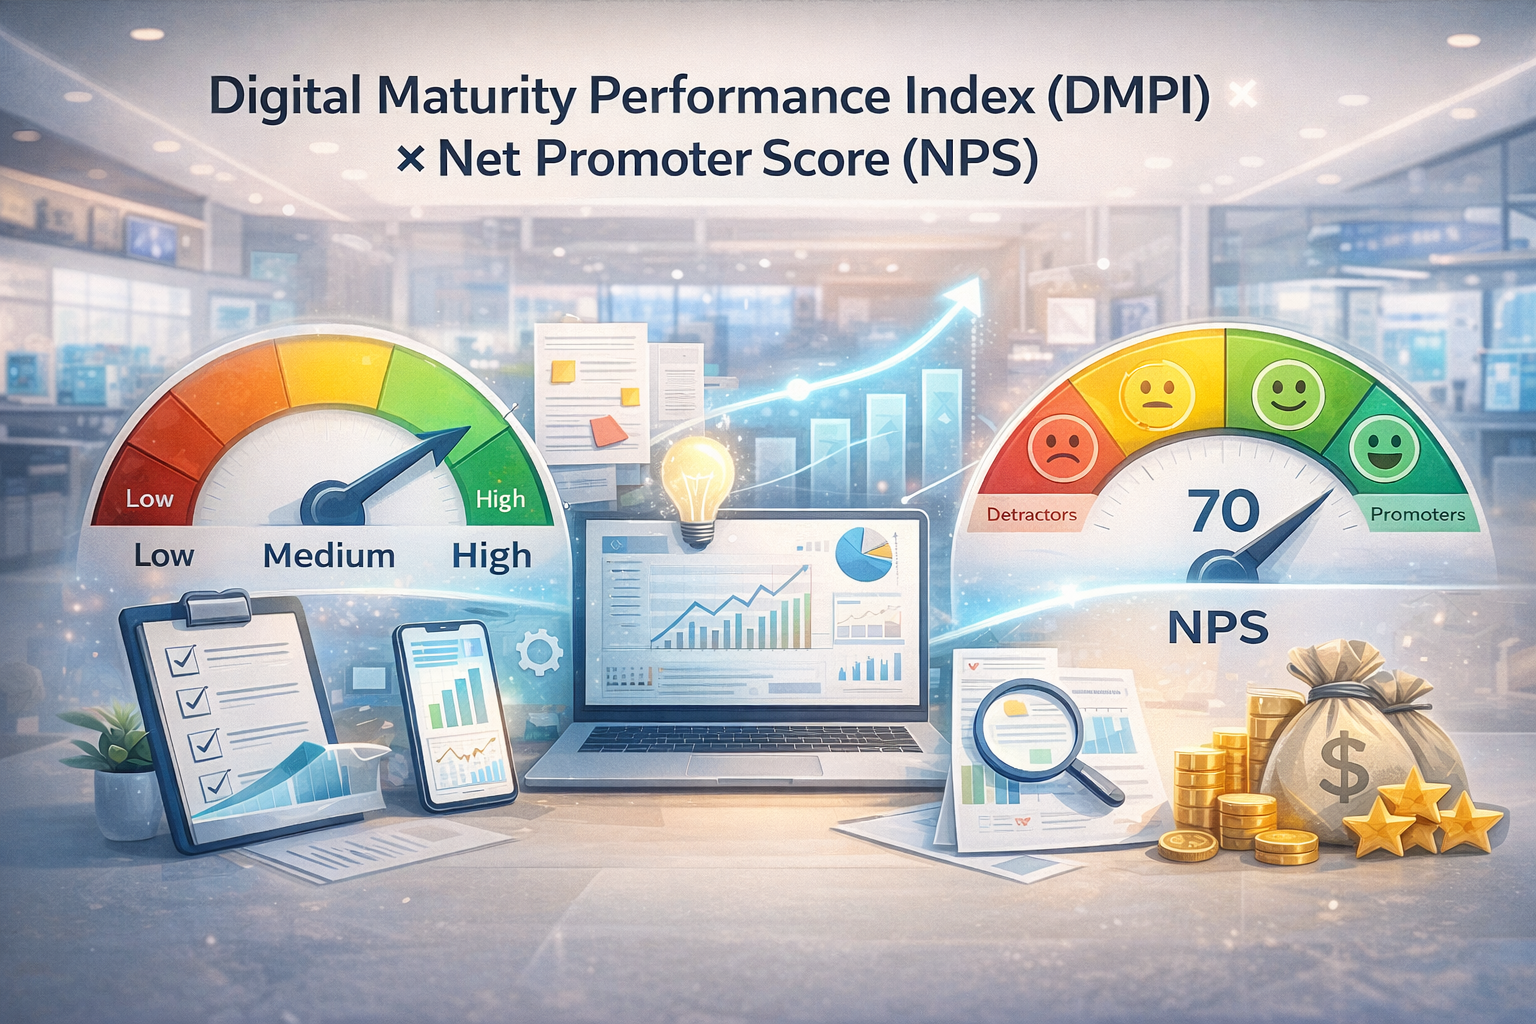
Master Thesis — Digital Maturity Performance Index (DMPI) × Net Promoter Score (NPS)
A case study measuring how digital tool adoption relates to customer loyalty and experience across nine BMS showrooms.
2023–2025 • Master of Science in Business Information Systems • FHNW
Context
Building Material Suisse (BMS), 9 showrooms
Data window
18 months (Jan–Sep 2023 + Jan–Sep 2024)
Core artifact
Digital Maturity Performance Index (DMPI)
Outcome metric
Net Promoter Score (NPS)
Overview
In this thesis, I investigated whether higher digital maturity translates into higher customer loyalty and experience. I developed a practical measurement artifact — the Digital Maturity Performance Index (DMPI) — and compared it with Net Promoter Score (NPS) across nine showrooms in German-speaking Switzerland.
Why this mattered
KPIs existed, but weren’t unified
The business tracked multiple digital KPIs, but they didn’t form a single view of digital performance and maturity across locations.
Digital investment needed direction
Without a comparable score, it’s hard to decide which showroom should get more digital investment versus service improvements.
Customer loyalty is multifactorial
NPS can be driven by digital tools — but also by human-centered factors like expertise, friendliness, appointment planning, and location.
What I built
A practical, comparable index (DMPI)
I consolidated separate KPIs into one weighted score so management can benchmark showrooms consistently and spot where investment will likely help most.
A scoring system grounded in percentiles
Each dimension was standardized onto a 5-point scale using percentile thresholds, enabling fair comparison across showrooms.
A showroom-level comparison framework
I compared DMPI with NPS (overall and by NPS sub-dimensions) to interpret patterns, exceptions, and actionable managerial implications.

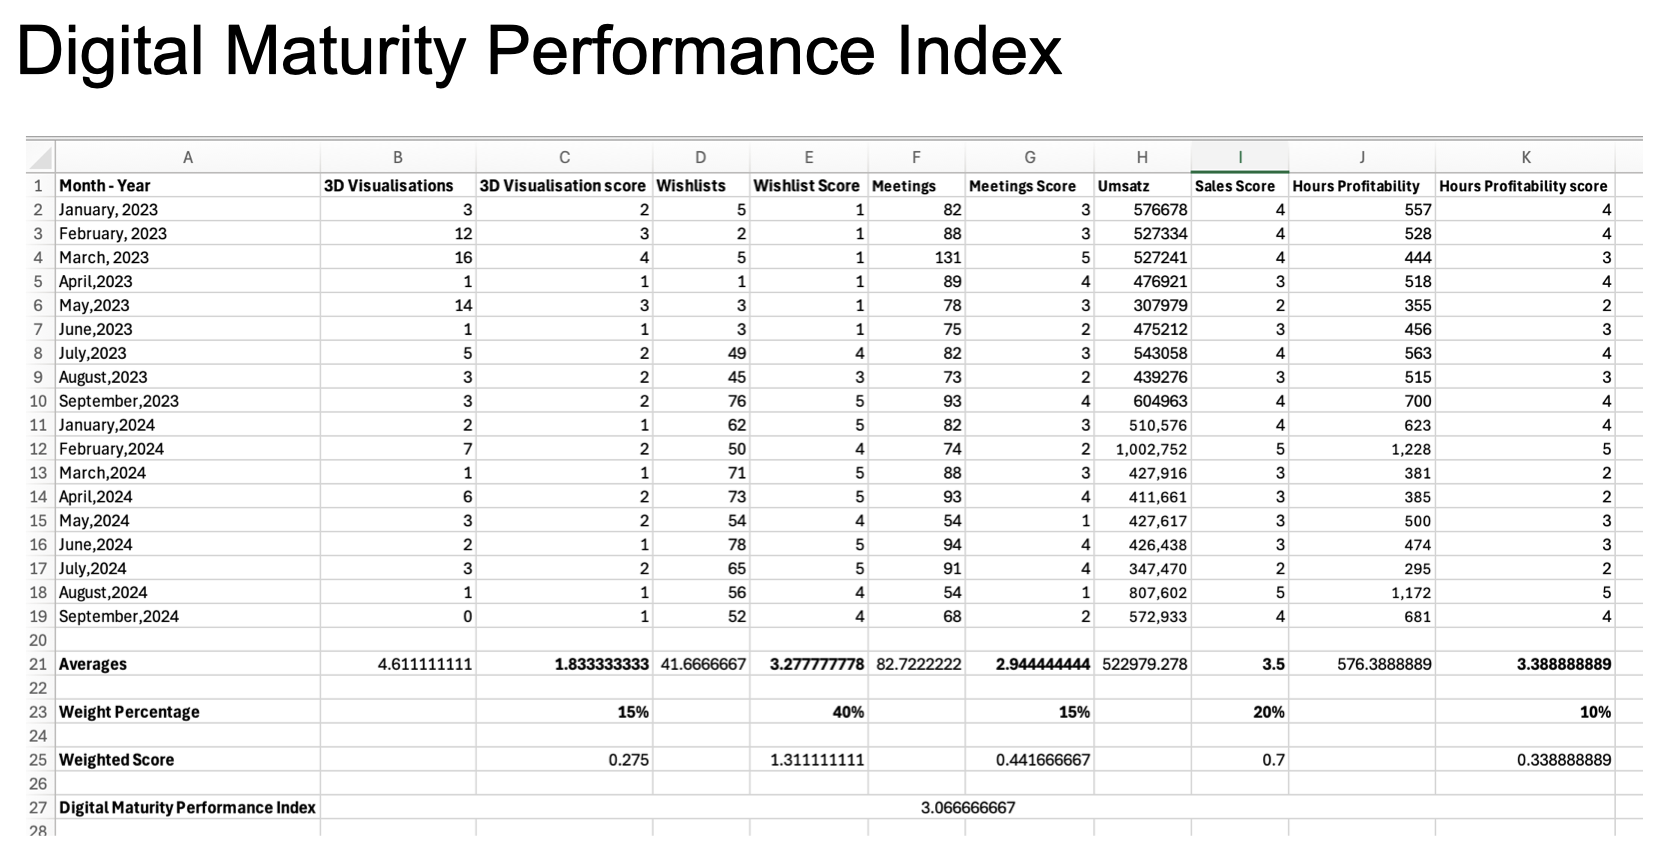
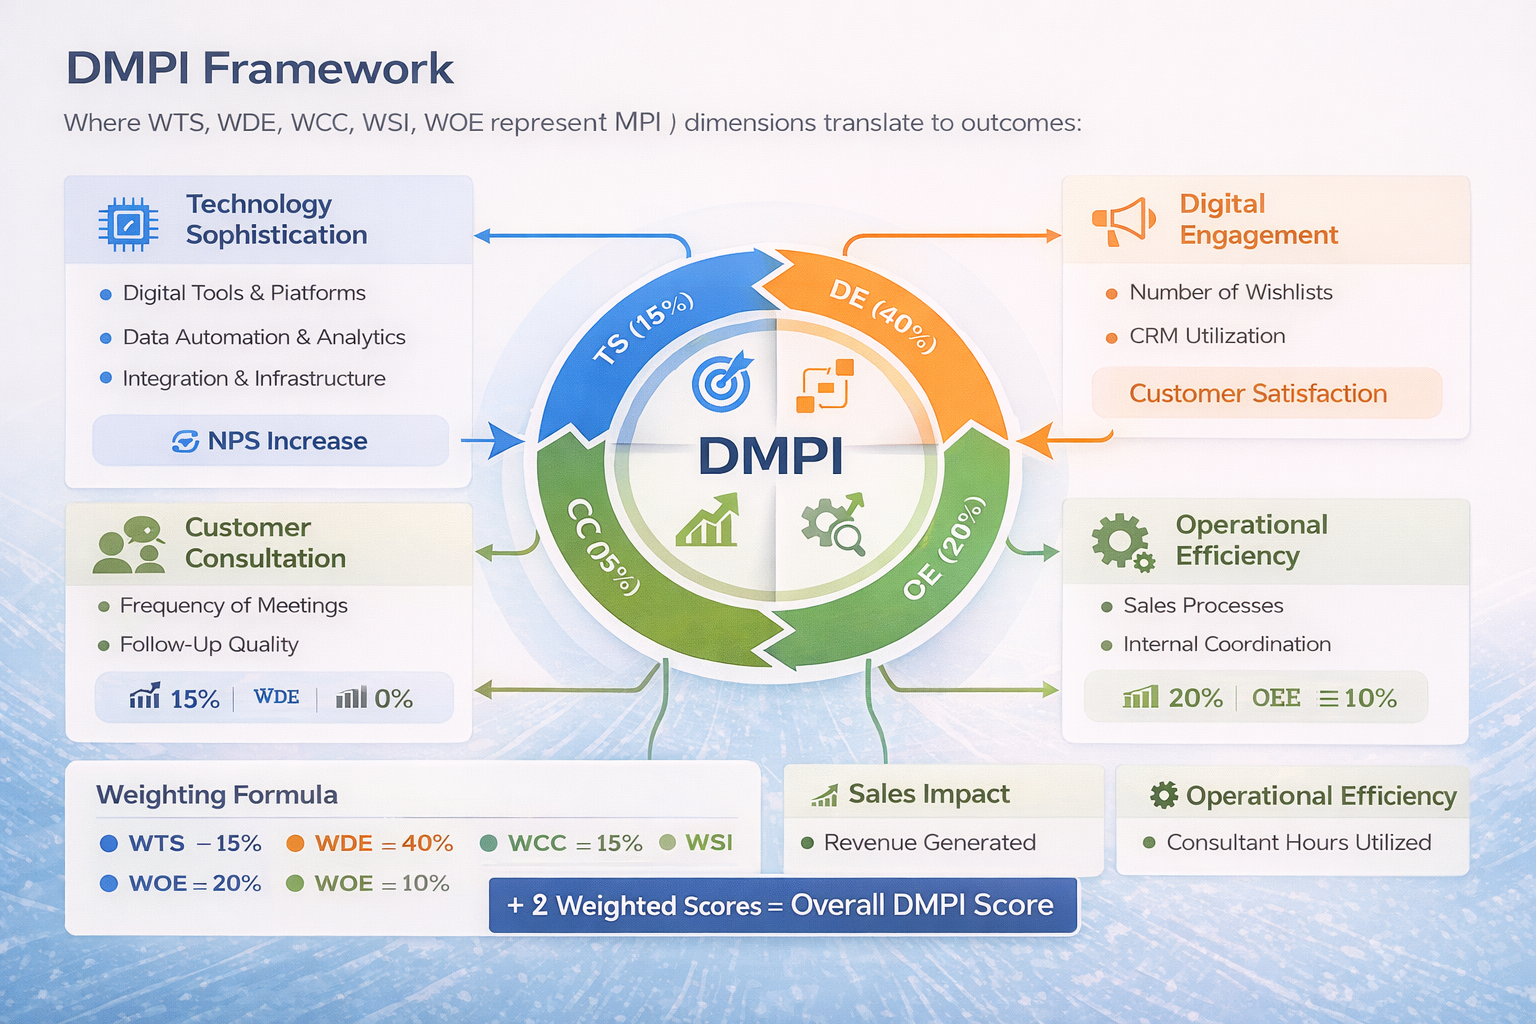
DMPI model
The DMPI is a weighted sum of five dimensions that represent how effectively digital tools are integrated into operations and the customer journey.
| Dimension | Weight | Key indicator |
|---|---|---|
| Technology Sophistication | 15% | 3D Visualizations |
| Digital Engagement | 40% | Wishlists |
| Customer Consultation | 15% | Meetings |
| Sales Impact | 20% | Revenue Generated |
| Operational Efficiency | 10% | Consultant Hours Utilized |

Results at a glance
DMPI scores (by showroom)
Composite digital maturity performance score.
| Showroom | DMPI |
|---|---|
| Basel | 3.06 |
| Bern | 2.025 |
| Chur | 3.53 |
| Jona | 3.54 |
| Kriens | 3.41 |
| Solothurn | 2.45 |
| St. Gallen | 3.28 |
| Volketswil | 2.51 |
| Yond | 2.98 |
Overall NPS (average)
Simple average across the NPS sub-dimensions.
| Showroom | NPS |
|---|---|
| Basel | 56 |
| Bern | 64.5 |
| Chur | 58.6 |
| Jona | 64.8 |
| Kriens | 67.5 |
| Solothurn | 73.8 |
| St. Gallen | 68.6 |
| Volketswil | 60.3 |
| Yond | 53.5 |

DMPI vs NPS comparison
Shows that higher digital maturity does not always result in higher customer satisfaction.
| Showroom | DMPI | DMPI category | NPS | NPS category |
|---|---|---|---|---|
| Basel | 3.06 | Medium | 56 | Great |
| Bern | 2.025 | Low | 64.5 | Great |
| Chur | 3.53 | High | 58.6 | Great |
| Jona | 3.54 | High | 64.8 | Great |
| Kriens | 3.41 | High | 67.5 | Great |
| Solothurn | 2.45 | Low | 73.8 | Excellent |
| St. Gallen | 3.28 | High | 68.6 | Great |
| Volketswil | 2.51 | Low | 60.3 | Great |
| Yond | 2.98 | Medium | 53.5 | Great |
Key findings
High digital maturity doesn’t automatically guarantee higher NPS
Some highly digitalized showrooms achieved only moderate NPS, suggesting that technology alone isn’t enough to drive loyalty.
Some low-DMPI showrooms outperformed high-DMPI showrooms on NPS
Solothurn and Bern highlight that strong service factors can sustain excellent customer satisfaction even with lower digital maturity.
Human-centered factors were consistently important
Dimensions such as staff friendliness and expertise aligned strongly with higher customer satisfaction across locations.
Digital tools work best when integrated strategically
Tools like 3D visualizations, wishlists and appointment planning help — but only when they reduce friction and fit the customer journey.
Key conclusion: digital tools can elevate the experience, but they must be paired with human-centered service factors (expertise, friendliness, appointment planning, and accessibility) to consistently drive loyalty.
Artifacts
DMPI framework overview
A visual explaining the DMPI dimensions and how they connect to customer loyalty via NPS.
DMPI formula + weights
Weighted-sum model showing how each dimension contributes to the overall DMPI score.
Scoring thresholds (percentile cutoffs)
Percentile-based cutoffs used to translate operational KPIs into a 1–5 maturity level.
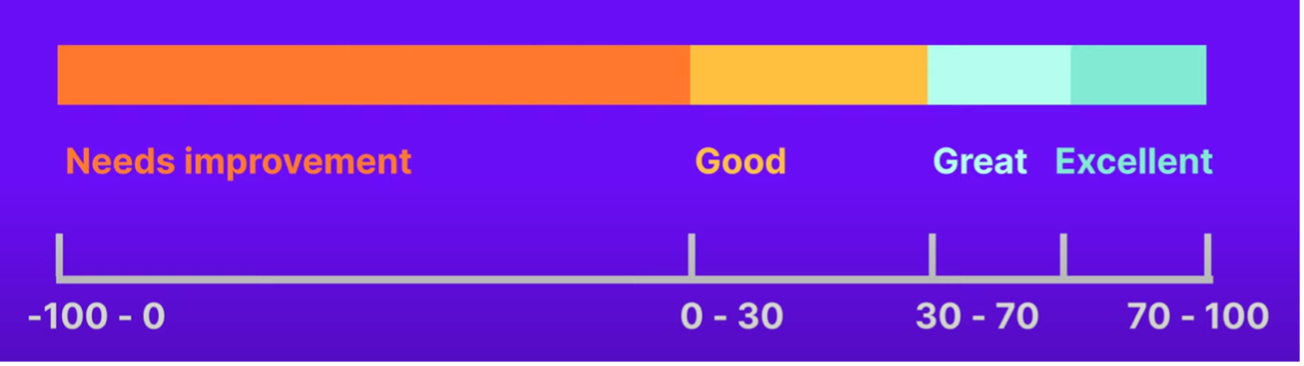
NPS scale visualization
The category scale used to interpret overall NPS (e.g., needs improvement → excellent).
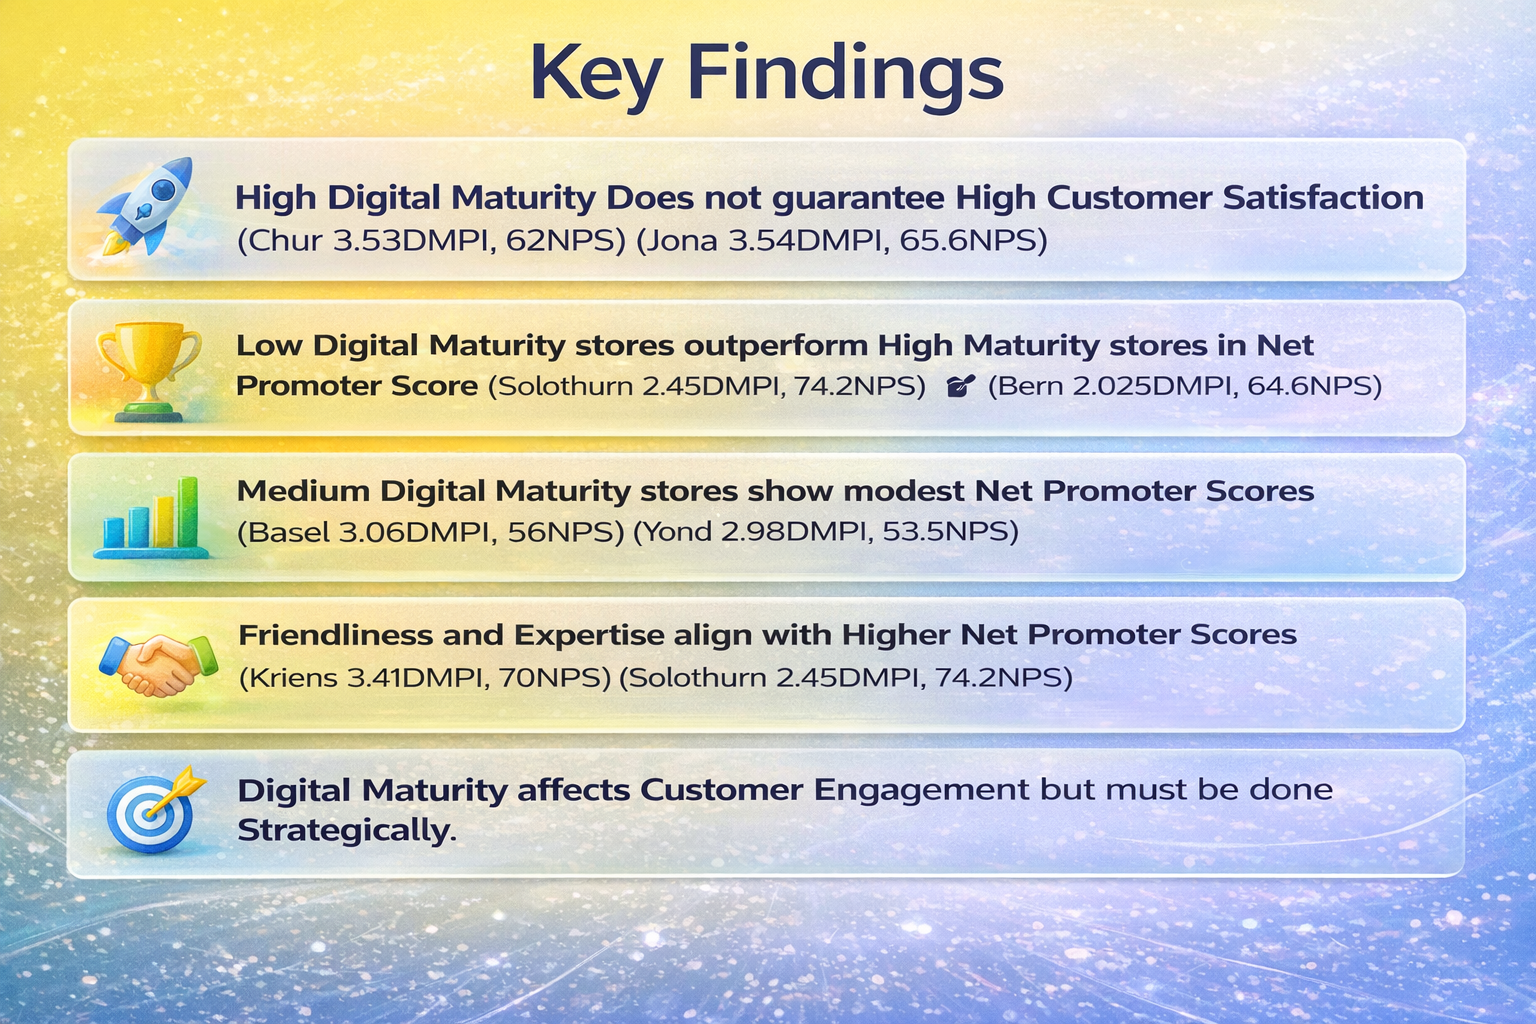
Key findings summary (slide-style)
A clean summary graphic of the main insights and what they mean for management decisions.
What I learned
Frameworks beat raw KPI lists
A single composite index is far easier for stakeholders to discuss than multiple disconnected metrics — but it must remain transparent and explainable.
The ‘why’ behind the numbers matters
Descriptive comparisons reveal patterns, but interpretation requires context: service quality, staff expertise, location accessibility, and process reality.
Digital maturity is not the same as customer experience
Digital tools can enhance experience, but loyalty depends on the combination of technology + human interaction.
Designing for decision-makers
The most valuable output wasn’t a statistical model — it was a tool that leadership can use to prioritize improvements across locations.
Want the full thesis?
I can share a PDF copy and a short walkthrough of the DMPI framework and results.